
 Late last year Australian demographer Bernard Salt famously and somewhat ironically mentioned in a satirical piece about baby boomers that smashed avocado on toast was the reason the hipster generation (meaning millennials) haven't found their way into home ownership. It went global even though he didn't really mean it. This misconception has been going on for a while. It's true millennials haven't been buying first homes in the same numbers as their forebears, but it's not because they've been brunching their home deposits away. First home buyers virtually fell off the Australian housing radar about 5 years ago. Some argue the increased cost of housing was the primary reason and it was all the baby boomers and their tricky tax break's fault. Not true. State governments' manipulation of housing grants and stamp duty exemptions (or the lack thereof) is demonstrably the strongest correlation with the disappearance of first home buyers (FHB's) in recent times. Essentially what happened was state governments reasoned that the affordability problems faced by FHB's were due to supply constraints. Not enough dwellings to go around. So they introduced incentives for FHB's to buy new property and removed incentives (like waiving stamp duty) for FHB's buying existing (older) properties. New properties in a given area are inevitably higher priced than existing properties (by more than a stamp duty saving) so all government did was raise the bar to a point that less than half the number of FHB's, compared to previous years, could do anything at all. Even though governments were right in a big picture, long term sense (it is a supply issue...but of their own making), they definitely created a classic case of throwing the baby out with the bath water. It didn't work. At least not for the target audience. Proving the point, they have now started reversing the process. The NSW government re-introduced stamp duty exemptions for FHB's buying existing properties in the last state budget with effect from 1 July this year. In recent months Queensland has seen the largest number of first home buyers in the market since October 2009. Across the entire country the number of FHB's as a proportion of all transactions has increased dramatically over the last few months. Gaze upon the following national data with wonder and amazement. There is a serious turning point happening before our eyes. 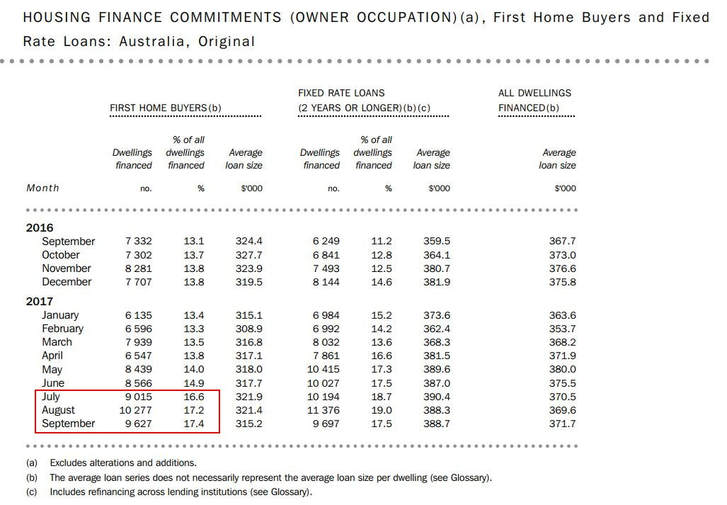 So despite significant price growth in some markets, tougher lending conditions and no changes to tax breaks, it seems FHB's are staging a comeback. And good on them. Incentives to get on the home ownership/property ladder have been around for decades, not as a market manipulation device but as a tax-payer funded social incentive to get a leg up. I received a first home buyer grant when I bought my first home thirty something years ago. Why should it be any different now? Aren't we the miracle economy? The envy of the known universe?
The solution was never to poke millennials with a stick. Governments need to look at the costs associated with getting new property to market. They have been playing with stamp duty exemptions (among other things) as a lever to pull to solve a supply issue when one of the real issues is the stamp duty rate itself. Stamp duty bracket creep is obscene. Rates haven't been reviewed or changed since the eighties. I've written about this before so I'll spare you the tirade. Suffice to say blaming the next generation of market entrants for planning failures and playing them as fools is a mistake. It's not their fault. In over 35 years of being obsessed with the behaviour of property markets I am yet to see a successful example of government intervention that has lead to anything but tears, for government. But there is always a silver lining. It's early days, but it will be really interesting watching the impact of all that latent first home buyer demand entering the market over the period ahead. The avocado apocalypse may be upon us. Sure, they may talk about work life balance and having a positive impact on the world more than past generations (as if there's something wrong with that), but no prizes for guessing which section of the digital newspaper they've been reading over their avocado toast for the last five years. They're coming...be prepared.  …it used to be that if you could get hold of some local property information and figure out what it meant, you had an edge over every other property investor out there. Those were the days.
I mentioned a while ago that back in about 1987 when we needed to do some comparisons on growth rates in different parts of Sydney we had to buy a clunky magnetic tape from the Sydney Water Board which contained the data we needed. It cost $40,000 ($95,000 in today's dollars). Today, for a fistful of dollars, you can get that information from many different sources and it would fit on the head of a pin. The question I keep asking myself is, are we really better off now or are we spoiled for choice? Ever since the Valuer General, Land Titles Office, ABS et al started digitising their data and selling it to the private sector about 20 years ago, we have seen a battle between a bunch of empires (evil or otherwise) vying for property data supremacy. Nothing wrong with competition… but there is a problem. Before I go on, I should confess to being a property data junkie and I reckon I’ve seen it all. Decades ago I paid thousands to councils for property data on microfiche (microfilm to spy novel enthusiasts). Twenty years ago I had John Edwards of Residex fame in my office for hours installing data from dozens of floppy disks. Not to mention the Water Board tape, online data subscriptions and many productive research projects with our good friends at BIS Shrapnel going way back to the early sixties. You can’t have too much information right? But too much isn’t the problem. The problem is nobody agrees on anything. Inevitably the data that gets released and grabs media attention one day will contradict the numbers released by another outfit the next day. Prices went up says one…prices went down says another. Not very helpful really. It boils down to different methodologies and the “robustness” of the data. At least that is what the data empires will tell you, but really the property data industry has become a race. A race to publish the latest numbers before their competitors and a race to find interpretations of data that resonate in the media space. A space race. Until a winner is declared, all I can suggest is, if you have an interest in following what is going on in a property market, be wary of, or even totally ignore, short-term fluctuations, stick with a single data source and try to stay focussed on the big picture. Maybe check out the chart library which has just been updated. May the force be with you.  Stamp duty in most places is calculated on a progressive scale which means the higher the price the higher the duty in both total dollar and percentage terms.
If you bought a $300,000 property in NSW, the stamp duty would be $8,990. Let’s say you had a lazy $3 million to deploy and bought 10 of those at $300,000 each, the total duty would be $89,900. Note: there is a provision for the Office of State Revenue to aggregate the total in some circumstances but go with me and assume that doesn’t apply in this case. If you opted instead to buy a single property for $3 million, the stamp duty would be, wait for it, a whopping $150,490. A difference of $60,590. Wow. By way of reality check, that difference is approaching a whole years income for the average Australian family. Serious money. Yet another good reason to stick to median or below median price points for individual residential investments. But that’s not the paradox. That’s just the mathematics of a progressive scale and me making a point. The real issue with stamp duty is the current rates were set years ago when inflation and capital appreciation rates were higher than they are in this low inflation environment and median values were a lot less than they are today. The scales haven’t changed since 1986. During the 26 years to 2013, Sydney’s median house price has increased at 7.7% per annum compound. The stamp duty collected on the transfer (sale) of a median priced house in Sydney increased at 9.9% per annum compound over the same period. The result of a progressive scale and increasing values. In 1986 stamp duty averaged (on the median priced Sydney house) around 2% of purchase price, today it is around 4%. What we have here is a form of bracket creep against a backdrop of lower inflation. Maybe it’s not quite a paradox but it is an issue that deserves some attention. There are voices out there calling for a review of the situation, which is clearly long overdue. In NSW another State Budget has come and gone and despite changes to the first home buyer rules and the dropping of rebates to investors, no change has been made to the stamp duty scales. I wouldn’t hold my breath waiting for the scales to change any time soon. In the meantime, remember the $300,000 example and buy new, buy low and buy often. Reprint (originally published in 2013)
Speaking of perceptions and realities, I was just reading another media piece asserting that a residential vacancy rate* of 3% indicates a market in equilibrium and therefore it can be construed that higher levels of vacancy equal bad while lower means good. It has become a conventional wisdom. I was in the room when a well known commercial property fund manager first uttered this alleged fact back in the mid eighties. We were both speakers on an investment panel in a hotel ballroom in Adelaide at the time. When he finished speaking I asked him how he arrived at 3% (I was the residential guy on the panel and he was in my space). He shrugged and motioned towards the sky where he had clearly plucked his “fact” from. It has been quoted ever since. Turns out he wasn’t too far off the mark as generalisations go, but as you know, I’m not a fan of generalisations. So I revisited the rental vacancy data from 1980 to the present day to establish the average vacancy rate for each major urban market over the last 32 years and here’s the deal: Sydney – 2.23% Melbourne – 2.52% Brisbane – 3.25% Perth – 3.34% Canberra – 2.55% Adelaide – 2.62% Hobart – 2.69% Darwin – 5.65% Clearly the take home is there are significant differences between cities with Sydney proving the tightest rental market over time while the capital cities of the mining states have had the highest vacancies in the long term. As an aside, taking a closer look at Darwin’s numbers, there have been a couple of extended periods where vacancy rates have exceeded 10%. If that happens again (as the mining boom continues to fade?) with median prices in Darwin already punching above their weight, we could see very substantial price declines as investors attempt to exit that market. Beware. More importantly, our largest cities Sydney and Melbourne have consistently out-performed other markets on the vacancy front which should translate to more consistent and reliable rental income over time. It also reflects the underlying strength of our larger markets over time in the all important supply and demand relationship. On that measure, big is beautiful. * The vacancy rate is calculated as the proportion of all properties in the private rental market that are vacant at a point in time, expressed as a percentage. I hope you’ve had a great start to the new year. Now that things are beginning to normalize as everyone gets back to work we thought it timely to send out a quick update. You may recall we sent you a message just before Christmas about new property recommendations in south east Queensland, today I’d like to follow up with some explanation as to why our market recommendations have shifted in recent times. Predicting the future course of any property market is more a function of supply and demand than anything else. The “Sydney” charts below illustrate a real and recent example of how prolonged periods of low construction can be (and generally are) followed by rising property values. 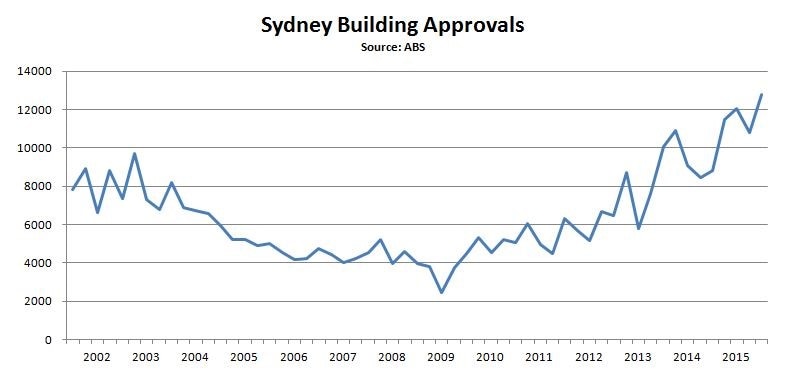 An extended period of low construction (combined with an increasing population) will eventually leave a market in a state of undersupply. The further a market falls into undersupply, the more upward pressure is applied to property prices, the result of which is a period of rising values as we’ve seen play out in Sydney over the last few years. 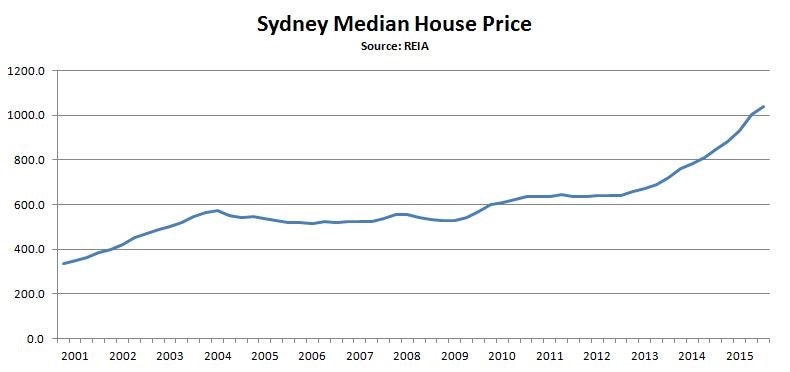 On the back of around 60% growth in values since 2012, construction in Sydney has now reached historically high levels. This will eventually lead to a period of stagnation, or even a slight decline, in values as supply outpaces demand. Queensland’s Gold Coast is currently presenting as fundamentally stronger than any major market in the country. Having experienced a number of years of low construction levels and sluggish growth this market is now in a strikingly similar position to Sydney back in 2011/12. 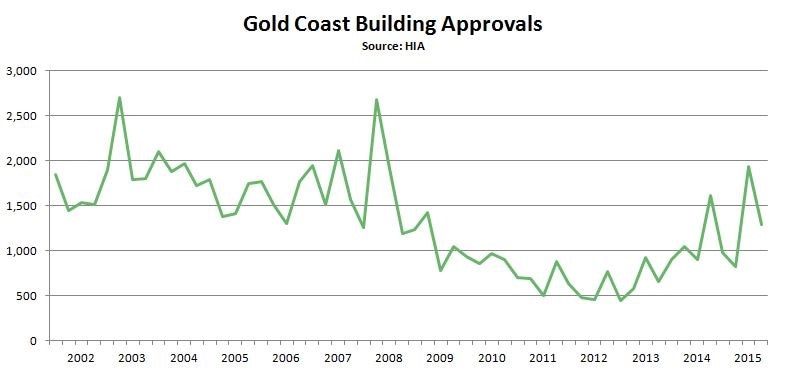 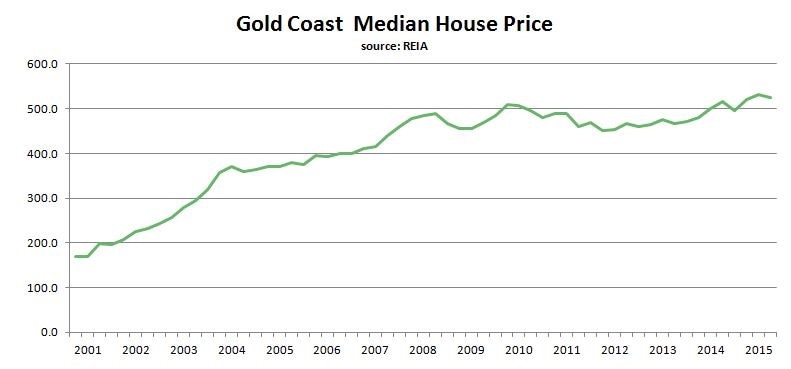 Consequently, we believe well researched property in the Gold Coast region at middle price points currently represents some of the best property investment in Australia.
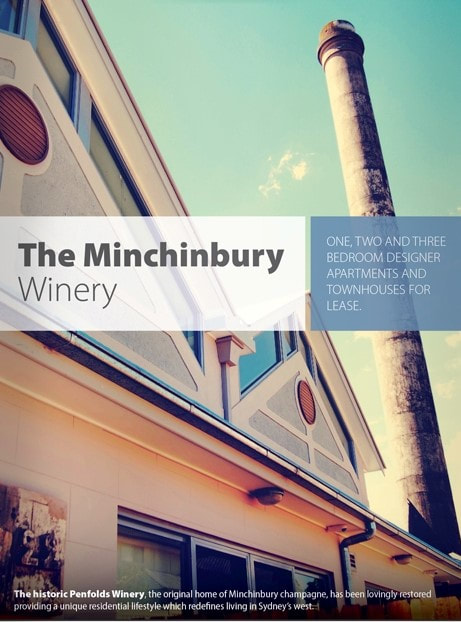
You may have noticed we’ve not been very vocal recently. Over the last few months we’ve been quietly working away on a plan for the period ahead. More on that in a moment… It’s no secret we’ve had a great run in Sydney (and more recently the Central Coast) over the past few years, the Sydney median house price has increased dramatically and all of us who recognised the opportunity should be well pleased with the results. Some recent highlights have included The Minchinbury Winery where RP Data valuations are showing increases of around 50% above purchase price. Durham Street Apartments which has finally come to fruition with pre-settlement bank valuations coming in over 30% above purchase prices. The Rise at Glenmore Park which settled around June and then in August three apartments sold for more than 20% above the original prices, not to mention Skye Apartments at Gosford where local agents are reporting sale prices more than 30% up on our stage 1 recommendation of last year. All in all, it’s been a productive couple of years. So what now?… With residential construction on the rise in Sydney, it’s inevitable that growth will begin to slow as the housing supply gap closes, we’re certainly not saying that this will happen overnight – it’s worth noting that the most recent REIA data release showed the highest quarterly growth in Sydney medians since June 1991 – but it will happen. It’s clearly time to be looking to other markets… As we mentioned back in April, we’ve been keeping a close eye on south east Queensland for a while now and after spending much of the last six months doing our homework, we now have a couple of new property investment recommendations in Brisbane and on the Gold Coast to share with you. The Gold coast is arguably in a better position than all other major cities at present. Building approvals fell away significantly in 2007 and have just started to climb again over the last couple of years. The lack of housing stock is evident in the low vacancy rate of 1.7% which has been trending down for the last five years and is now lower than all capital cities. Median house prices are only 7.1% above the peak of eight years ago, leaving significant room for future growth. 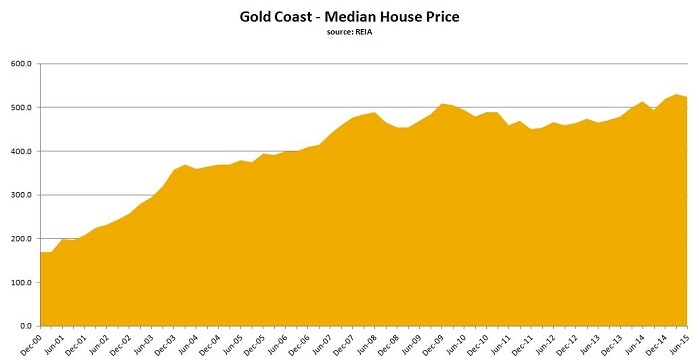 While we believe the outlook for the Gold Coast is promising, it should be noted that this is a comparatively smaller market and, due largely to it’s lack of economic diversity, can be a tricky one to navigate. For the best result, property in this market should be carefully selected based on a clear understanding of local demographics. 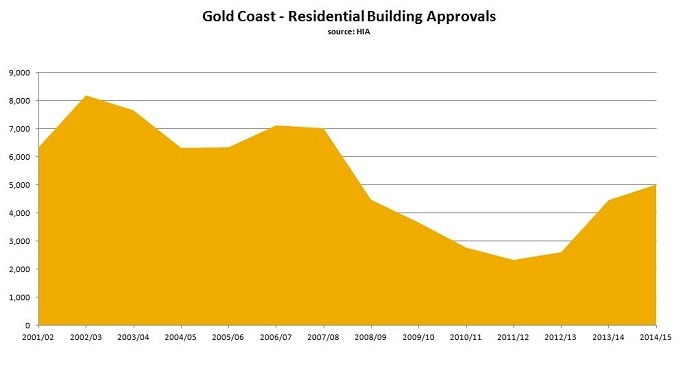 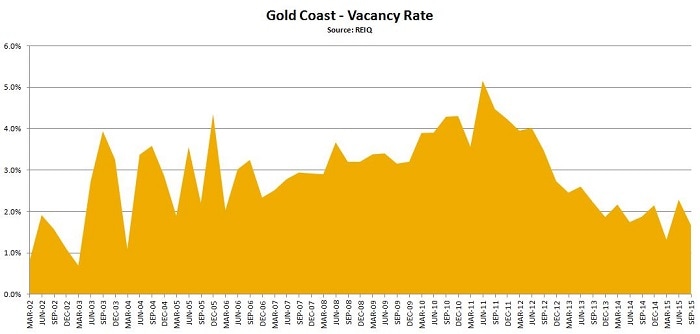 Brisbane, while not presenting as strongly as the Gold Coast, does offer a viable alternative for the more risk averse investor. Being a larger city (around four times the size) and supported by a wider range of industry, the Brisbane economy is less susceptible to outside variables and may provide a greater level of stability over the longer term.
It should be noted that construction activity has increased significantly in inner Brisbane recently and investors should be carefully targeting middle to outer areas in close proximity to transport and employment hubs.
Building and economic forecasters BIS Shrapnel are in the news having predicted a further 20% increase in Sydney prices over the next two years. This is on the back of gains over the last 3 years of around 35% underwritten by the ongoing shortage of Sydney property built up over 10 years of below average construction.
They are also forecasting significant uplift in values in the Brisbane and South East Queensland market generally over the next few years. We have been watching that market with increasing interest for a while now and we’ll keep you posted as markets shift between stage of cycle phases (see comments on the Sydney rental market below). Some property owners view the buoyant Sydney market as an opportunity to sell and realise the gains made throughout the Sydney metro area in recent times. While we’re not suggesting this is the best way to go (remembering our old adage “always buy – never sell”), it is interesting to see the prices properties are now attracting. Apartments in The Avenue, Mount Druitt which originally sold at prices ranging from $245,000 to $275,000 for a typical two bedroom, two bathroom, are now changing hands in the mid $300,000’s with a top sale price of $355,000. A slightly smaller apartment in that building is on the market at $349,000 with a tenant in place at $350 per week. Brand new apartments in Mount Druitt are now selling at upwards of $385,000. Even more impressively, The Minchinbury Winery development in Barossa Drive, Minchinbury has had two “townhouse style” apartments sell at $556,500 and $489,000. These were originally purchased (with settlements a mere 16 months ago) at $455,000 and $375,000 respectively. It may be a good time to review your portfolio and start thinking about your next move. UPDATE: Skye Apartments, Gosford The Stage 1 release of this project was very quickly taken up by investors seeking capital growth opportunities. We have recently visited the site and met with the developer for a progress briefing. Excavation has commenced and the basement level should be reached in the next week or so. Completion of stage one is estimated (at this early stage) to occur in early 2016. Bankers burst the bubble bubble The Australian Banker’s Association (ABA) have released a new report which concludes a price bubble does not exist in Australian residential property markets. In itself a reasonable conclusion (in our view) and based on solid and well presented data and evidence. The interesting part is the vitriolic rage in response to the media’s coverage of the report. “No bubble? How dare you”, they rant from the digital rooftops. There is so much misinformation AND disinformation out there these days it seems the truth isn’t going to get in the way of a good conspiracy theory anytime soon. We have long argued that property price bubbles are perfectly normal…just misunderstood. Here’s a piece we published a few years ago on the subject: Yes Virginia, there is a property bubble  The Sydney residential market has begun to gain some serious momentum over the last twelve months, recording growth in median house prices of twelve to fourteen percent. A solid result in a low inflation environment which has been widely covered by the media but behind those headlines we find some interesting realities:
On the supply side of the equation, building approvals have begun to pick up but we still have a long way to go before the supply & demand equation reaches equilibrium. This, weighed with the fact that real growth in Sydney over the last decade is only just catching up with inflation, indicates there is room for Sydney values to grow further over the period ahead. For a variety of reasons relating to price point, existing and future infrastructure, local demographics, employment and transport to name a few, we currently favour medium density property in Sydney’s western corridor, between Parramatta and Penrith. With that in mind we’d like to draw your attention to a new investment recommendation which is available now with completion estimated for mid to late 2015. Blue Vista, is situated in the Sydney suburb of Glenmore Park and consists of thirty-nine dwellings in one, two and three bedroom configurations, ranging in price from $325,000 to $470,000. The average two bedroom apartment is around $395,000. It is across the road from a project we recommended to clients just before Christmas which was very well received due in part to its bite-size price and impressive location. For investors acquiring a two bedroom apartment, using 100% borrowed funds, we estimate a year one annual after-tax holding cost close to break-even at the 37% marginal tax rate and becoming cash flow positive at higher tax rates.
There are so many questions. Where to buy? Which region? Which suburb? What will it really cost? What kind of finance? New property? Resale property? House or unit? Whose name to put it in? Ongoing management? Pay it off? Cash or equity? City, commuter, suburban or exurban locations? What to avoid? On it goes.
All these questions can become frustrating obstacles which lead to inaction and lost opportunities simply because no amount of desktop research or friendly dinner party banter can substitute for experienced, professional advice. You see where I’m heading with this right? We’d like to start the New Year on the right foot by sharing our time and experience to help you get on the right track with property investment and make the most of what’s going on in Sydney right now. A fresh start in a fertile new year filled with possibilities – click here
 There are pretty much only two kinds of property investor, active and passive, but it’s important to know the difference.
In the investment world generally the words active and passive tend to define an investment style which is either seeking to reflect the performance of the market (usually the share market), called a passive style or is seeking to outperform the market, known as an active style. There has been lots of debate over the years about the merits of both styles as well as the observation that both tend to end up under-performing the market in which they are invested anyway. The reasons for the average under-performance in both investment styles is that passive managers charge fees and have costs which erode the “indexed” result generated by the market. Active managers have even higher costs and tend to have winning and losing investment positions which average down to below the “indexed” result. Some commentators have even observed that the managers who do out-perform their underlying market were probably just lucky in having a few more winners than losers that particular year. Examples of the same active investment managers out-performing consistently year after year are rare. Direct investment in residential property is different in many ways and on many levels. But there is still a distinction to be made between the two approaches. An active property investor is a speculator. Someone who typically has a relatively short time horizon and a desire to make money fast. The risks are high. The timing is critical. These are the renovators, developers, flippers, bargain-hunter and DIY, hands-on types who roam open houses every weekend and, if my experience is any guide, are the ones who know the least about the macro or big picture issues at work in the market. They are subjective and often don’t really see the wood for the trees. They devour the daily real estate media, watch all the renovation shows on television and think last weekends auction results are a good market indicator. A passive property investor is an accumulator. Someone who sees long-term growth exceeding inflation and leverages that growth to increase their equity and therefore net worth over time by growing a portfolio of property. The risks are lower. The timing is still important but not as critical. These people tend to be objective, patient and busy. Objective because they see the property market cycle from a medium to long-term perspective. Patient because they know there is no such thing as a fast buck without commensurate risk. Busy because they have active careers and families and little desire to spend their free time chasing short-term speculative profits. These two approaches to property are very different animals. They can be taxed differently and they carry vastly different levels of risk. I suppose it’s obvious which of these I advocate as the strategy that stands the test of time. It’s just that almost all the people I meet who have tripped up in property (some in devastating ways) have fitted the active profile. I am a passive property investor. I do not buy old properties to renovate. I do not develop property (but if I did, I wouldn’t call it investment). I do not read the daily real estate press (unless I’m in it). I think auction results are close to useless information. I have a life apart from my investments with free time to pursue my passions. My investment properties grow in value because I understand the market mechanisms at work and focus on accumulating a portfolio of income producing properties bought at the right price, in the right place at the right time to hold at minimal ongoing cost for long-term capital appreciation. Which kind are you?  Just over a year ago we issued a detailed Sydney market report which forecast the resurgence in Sydney market activity that is currently making headlines. With that forecast now a widely accepted reality, we should all turn our attention to how the upturn in Sydney will unfold over the period ahead.
But first here’s a recap on some of our observations in that report back in July 2012: “The Sydney residential market is fundamentally strong. The current imbalance between supply and demand should drive values through the period ahead. In the short term, higher value market segments may not perform as well as middle and lower value segments as higher value property is prone to volatile price movements in times of general economic uncertainty. The western and north-western regions of Sydney have been experiencing lower vacancy rates and higher levels of population growth than greater Sydney over recent years. Western Sydney also offers a level of affordability to both home buyers and renters that cannot be found in other regions of Sydney. Due to rising costs in the construction of new property we do not expect to see a significant boost in levels of construction until such time as values have risen and the viability of new development projects improves. The market will remain under supplied for the next three or more years, continuing to place pressure on values and rents. Quartile currently recommends investment in new property, primarily medium density, in the western corridor of Sydney (between Parramatta and Penrith) priced below the Sydney median value ($462,145) where design configurations reflect local demographics.” It’s now obvious Sydney sales volumes and prices are on the move. Yet some people can’t seem to get their heads around the fact that prices are rising despite Sydney already being Australia’s most expensive city. The thing is, Sydney has always been our most expensive city and probably always will be. It has our largest population, second highest incomes (after Canberra) and more importantly, most constrained land supply. The relativity between Sydney prices and other cities waxes and wanes over time depending on where each city is positioned in its unique property cycle. At present prices in most other cities are closer to Sydney’s than they have been in a very long time. But Sydney is about to lurch ahead and re-establish its pre-eminence in relative value terms. So what happens next? The current Sydney median house price is less than it was ten years ago in real terms. I’ll say it again. Excluding the effect of inflation on prices, Sydney houses are cheaper today than they were in late 2003, ten years ago, at the peak of the last Sydney upturn. When you see press reports about bubbles and over-heating in the Sydney market, understand, and perhaps have a quiet smile to yourself, that this market upturn is just beginning. It is still early days. Nevertheless, there are things to be aware of and strategies to employ to steer a productive course through a market that is starting to hit its straps. Affordability is an issue and I would suggest that the strategy we were advocating a year ago (and long before that) is still appropriate. Which is, focus on affordable property. The properties I want to own as investments are the ones that the largest possible number of people need, want, desire and can afford. If that means considering Sydney’s west, then consider Sydney’s west. I’ve said many times that the most common error people make in attempting to comprehend how residential markets work is confusing desirability with performance. Growth in residential values has little to do with aspirational values. Over time a property, suburb or region will not out-perform others because it is “nicer”. It will no doubt be higher priced because it is a more desirable area but will not necessarily grow at a faster rate. At the extreme end of that phenomenon, very high value properties may be the celebrities of the real estate world but the reality is they are volatile creatures experiencing euphoric highs and tragic lows over time. The next phase in Sydney will see the rate of price growth accelerate as more participants enter the market and sales volumes increase further. Rental growth will slow as tenants exit the rental market in favour of home ownership while the supply of rental property will increase as construction rates move up in response to higher values underwriting the viability of new projects a proportion of which will be acquired by investors and placed in the rental market. This will play out over the next three or so years. What we are seeing in Sydney is a classic market upturn where demand exceeds supply, median prices are moving up across all market segments, rental yields are at cyclical highs and interest rates are fortuitously attractive. So history does repeat after all. Back to the future. Again. As the Sydney residential property market moves firmly into the recovery phase of the cycle, talk of a price “bubble” has re-emerged.
You may recall a story I wrote a couple of years ago called “Yes Virginia, there is a property bubble”. The point of the story was that price bubbles are normal, not to be feared or derided. In my view nothing has changed. As the commentary heats up, it is really interesting to me to watch the different views and reactions various interest groups have in response to housing market activity. The big end of town (bank treasury departments, the RBA and other macro economic types) seem to get it, taking a fairly objective view of the supply and demand equation and generally observing the market is behaving within long-term expectations. Pretty much the economic rationalists of the property commentariat. I have to say some quality research work has been coming out of the banks in particular in recent times. At the other end of the spectrum, Gen Y (the prospective first-time buyers among us) would love to see prices move lower as they strive to gain a foot-hold in the market and it is this cohort that shouts loudest about bubbles and market distortions while waving the finger at baby-boomers for allegedly using up all the good times. Out of this group also comes the new world order devotees. They are the people who believe all the rules have changed, history doesn’t repeat and it is going to be tougher for them to achieve their goals than at virtually any time in human history. What a nonsense. Ironically, some of their parents believe them! Interestingly, there’s another group who have sprung to life in recent months and that is impatient investors. I don’t mean investors buying, I mean investors selling. After years of waiting for Sydney to kick into gear, with obvious signs of life now evident in the market, some investors are seizing the opportunity to sell, apparently in the belief that the increased activity is a short-lived exit opportunity. I think anyone who sells residential property in Sydney now will probably regret it in a few years but such is the nature of human behaviour. There’s a chapter in one of our books called Always Buy - Never Sell which highlights some of the thinking that motivates people to go down that path. It has been widely reported that investors are in fact driving the recovery in Sydney sales volumes and prices. There are two main types of residential investor, yield-seeking and growth focused. Yield-seekers tend to be older and, motivated by falling returns on bank deposits, turn to rental property to provide income while also attracting capital growth to preserve the real value of their capital. Growth-focused investors are in the asset accumulation phase of the investment life cycle and are looking for markets where the prospect of increased prices is evident. Both those groups are out in force in the Sydney market at present. In bubble terms, the group to watch are the growth investors. Their numbers will swell over coming months as it becomes increasingly obvious that the market is moving. As usual, the ones who wait until prices approach the cyclical peak are the ones at risk of taking a bubble bath. Whether that peak occurs in 3, 4 or 5 years time we’ll all know after the fact. In the meantime – seasoned investors know it is better to enter the market too soon than too late. One of the triggers in the recovery stage of the residential market cycle is the point where it becomes attractive to tenants, based purely on the cost of living in an environment where rents have been rising and interest rates have been falling, to consider making the leap from renting into home ownership. When a market reaches this point, it usually follows that first home buyer demand picks up in overall volume, which in turn starts freeing up other market segments as non-first home buyers take the opportunity to upgrade their homes. A butterfly effect ensues and we see an increase in sales volumes flowing up the property food chain and into the broader market. Here’s the current comparison between buying and renting in the Sydney market that I mentioned a few weeks ago: 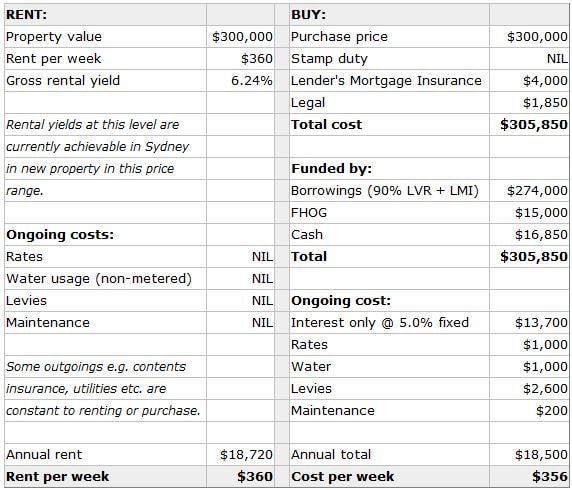 The key to this example is buying new property (to qualify for grants and stamp duty exemption), having sufficient cash deposit and being able to demonstrate at least 5% genuine savings to satisfy a lender. This requirement may be met in some cases with evidence of meeting regular commitments in the past such as rent. It may also be possible to borrow a higher percentage and therefore require a smaller cash deposit. This would add to the ongoing cost. At 95% LVR the additional cost equates to $17 per week including a higher LMI premium.
A pedantic reader will point to the opportunity cost of foregone earnings on savings if used as a deposit for purchase. While technically correct I’d suggest that it carries little weight in the actual decision-making process and is negligible anyway. So there you have it. Keep an eye on the Sydney market and the progressive increase in numbers (albeit off a very low base) of first home buyers and their impact on prices over the months ahead. 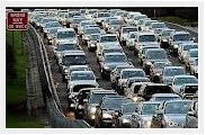 Sydney is renowned for traffic congestion, long commute times and lack of public transport yet somehow Sydney’s 4.6 million people manage to get to work (or school or play) every day. A quick check of the perception versus reality barometer reveals some interesting and slightly counter-intuitive things. The perception that Sydney’s congestion is getting worse does appear to have legs, but only just. During the ten years from 2000 to 2010 the average commute distance in Sydney (from home to work) has increased by 300 metres and the average commute time has increased by 1.6 minutes according to a report published by the Department of Infrastructure and Transport in October 2012. The interesting bit is the change in both direction and growth of commuter flow. The strongest growth in numbers of commuters has been in an outward direction. The next largest increase has been people commuting within their home region followed by within their immediate local area. The number of people commuting towards the Sydney CBD grew at the slowest rate. Apparently Sydney is an expanding universe moving away from its core at an increasing rate despite the perceived gravitational pull of office towers and harbour views. This makes sense as Sydney becomes increasingly regionalised and is in keeping with the “self-containment” objectives of Sydney’s planners whereby more people will work closer to home as employment is encouraged and developed in Sydney’s major residential regions. A good example is the progressive development of the employment zone on the old Australia’s Wonderland site (and beyond) near the intersection of the M7 and M4 motorways (shown in purple on the map below). The nearest commercial centre is Mount Druitt, a major centre in Blacktown Council’s draft local environmental plan and a major beneficiary of change. The nearby residential precincts of St. Marys, Rooty Hill and Minchinbury will also directly benefit from this “self-containment” process as it unfolds over the years ahead. While Sydney patiently waits for transport infrastructure to catch up with population growth, having a more immediate impact is the move to bring employment to the people which is being actively encouraged by government (to save money) and the private sector (to locate closer to their workforce). The centre of the universe is shifting. 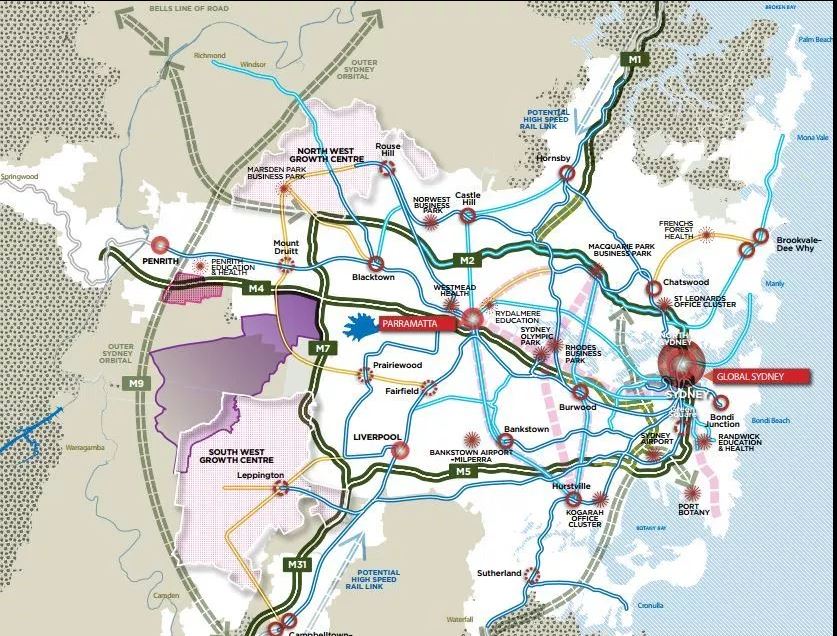 After a very long run of patchy weather it looks like the sun has come out over the Sydney residential property market with new forecasts predicting Sydney will out-perform all other major markets over the next three years. “A sizeable deficiency [of stock] and improved affordability due to lower interest rates appear to be finally having an impact on Sydney residential prices, with the rate of price growth expected to strengthen”, says BIS Shrapnel in their latest edition of Residential Property Prospects. 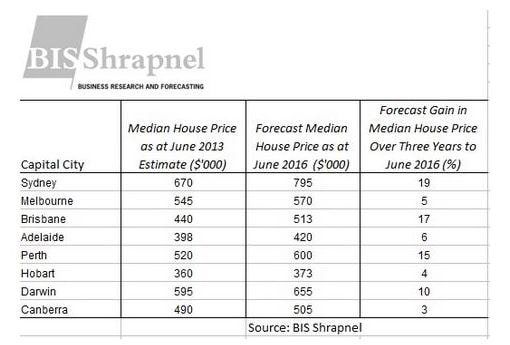 …and you know what they say about making hay while the sun shines!
 YES VIRGINIA, THERE IS A PROPERTY BUBBLE
Background: In 1897, prompted by her father, eight-year-old Virginia O’Hanlon wrote a letter to the editor of New York’s Sun newspaper wanting to know if Santa Claus actually existed, and the response, titled “Yes VIRGINIA there is a Santa Claus” was printed on 21 September 1897. It has since become history’s most reprinted newspaper editorial, appearing in part or whole in dozens of languages in books, movies, and other editorials, and on posters and stamps. “DEAR BRETT: I am 38 years old. “Some of my friends say there is no property bubble. My accountant says, ‘If you say there is – then it’s so.’ Please tell me the truth; is there a property bubble?" VIRGINIA O’REALLY VIRGINIA, your friends are wrong. They have been affected by the short attention span that is symptomatic of the information age. Despite our vast knowledge about so many things these days we relentlessly deny the obvious and believe the unbelievable. Yes Virginia, there is a property bubble. It exists as surely as night follows day and indeed represents the very essence of the living, breathing, dynamic thing we call the residential property market. A market made up of millions of real people, living in real houses, paid for with real money, from real jobs, doing real things. How dreary would our existence be if property bubbles didn’t exist and house prices moved in straight, predictable lines. Of course it could only be so if people and their quirky collective behaviour were removed from the picture and that would be no fun at all. In fact a property market devoid of real people would clearly be quite pointless. There are many wondrous things in our world Virginia, not least of which are the amazing technologies that provide everyone with a platform to express an opinion, champion a cause or push a barrow. Perhaps therein lies the cause of your doubt. It may well be the murky confusion of conflicting opinions and mixed motives that blurs the issues and questions the very existence of property bubbles. In the free market economy in which we choose to live, there will always be property bubbles. Fluctuation in prices, up and down, is as essential to the operation of a free market as breathing is to life. Not believe in property bubbles! You might as well not believe in capital gains taxes or state stamp duties providing revenue for schools and hospitals. Virginia, you could no doubt enquire of strangers on the street what they think about property bubbles and many would likely blame the bubble for all things evil in our wonderful world. Others would have no idea what you were talking about. It is so sad to see people being browbeaten into a state of bubble mongering or even worse, outright bubble denial. The question isn’t whether bubbles exist, it is about why they exist, understanding how they behave and using the bubble phase of the property cycle to advantage. It has become popular, even opportunistic to decry the phenomenon of market cycles and misrepresent or just misinterpret their impact. This is because most people misread the property cycle and enter the market at the wrong time. The way to deal with a property bubble is to anticipate bubble formation conditions and enter the market in the pre-bubble phase. The subsequent ride on the bubble-coaster can be exhilarating and hugely rewarding even with the inevitable deflation which will occur beyond peak bubbleocity. This takes guts Virginia, always has, but it is the time-honoured way to use the bubble for good not evil – to create a positive outcome, to reach your goals. It is called counter-cyclical property investment. The alternative is to join the conga line of property investors who refuse to believe it until they see it and wait until the bubble has begun to form, enter the market at a highpoint, take a bubble bath, then start a blog to tell the world it’s the bubble’s fault. They didn’t read the signs and paid a price. Property investment isn’t a walk in the park. It is a complex exercise, requiring careful planning, based on quality information and an ability to see the big picture, to recognise the real opportunities. So yes Virginia there is a property bubble. It is real, it is normal and will ever be so. In a thousand years there will be property bubbles just as hundreds of years ago there were bubbles in the trading of spices and tulip bulbs – fragrant bubbles indeed but bubbles nonetheless. They form when people act in unison to drive a price beyond its longer term intrinsic value. This will almost always happen. It is in the nature of free markets to overshoot on the way up, forming a price bubble, and overshoot on the way down providing what is often a once in a generation opportunity to enter a market. All you and your friends have to do is know the difference. |


The inside information on residential property investment