
|
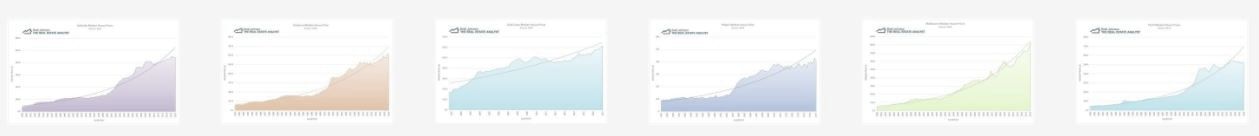
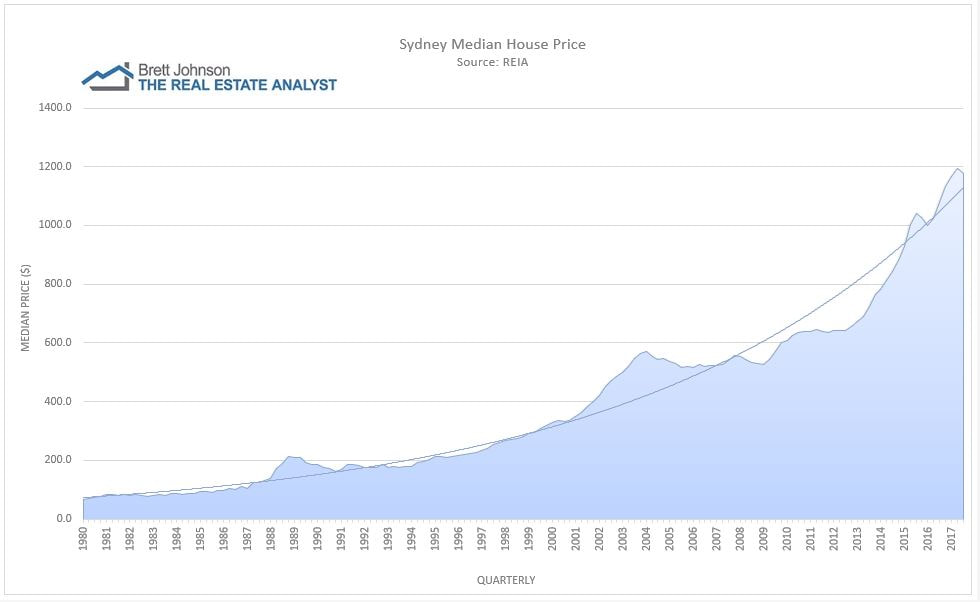
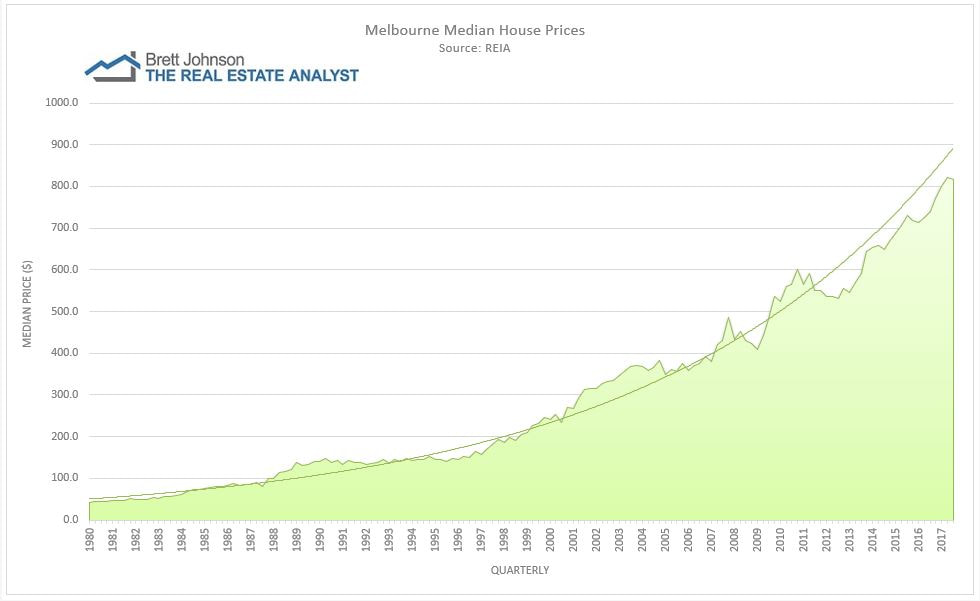
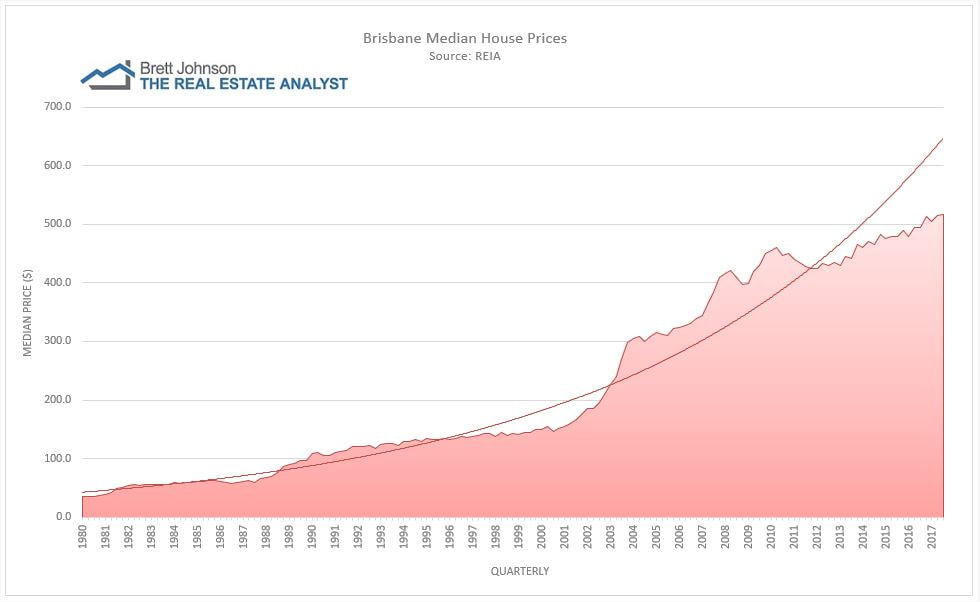
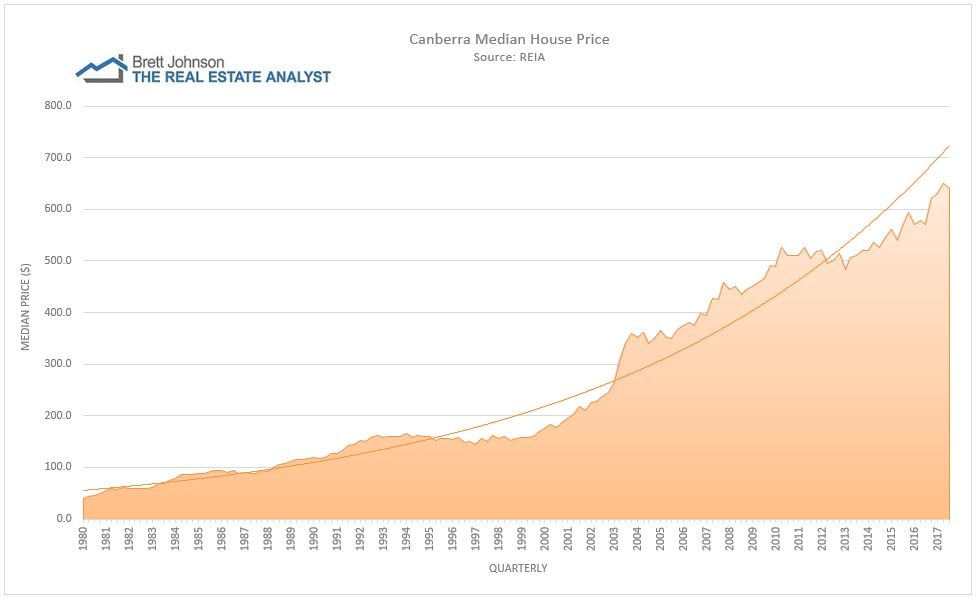
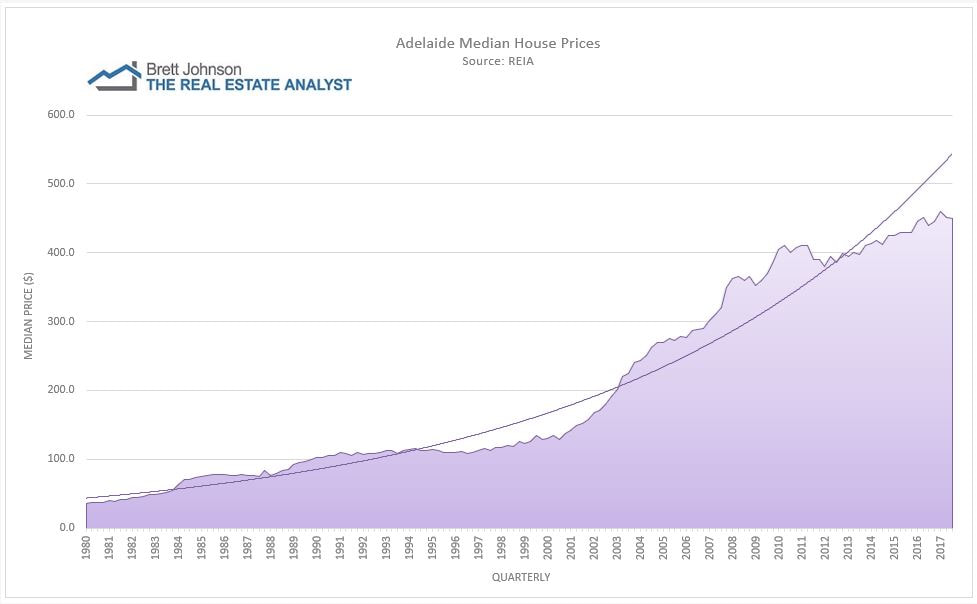
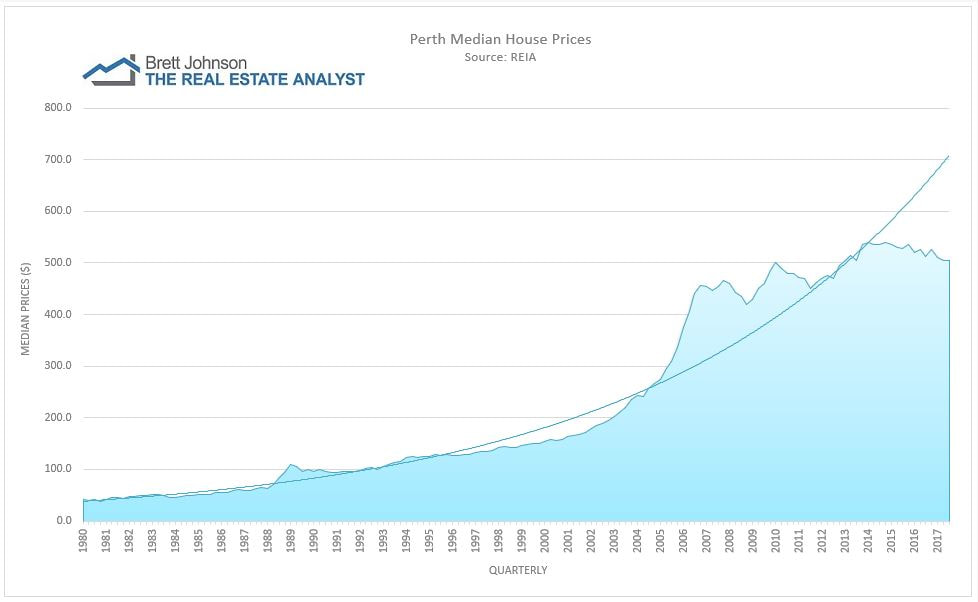
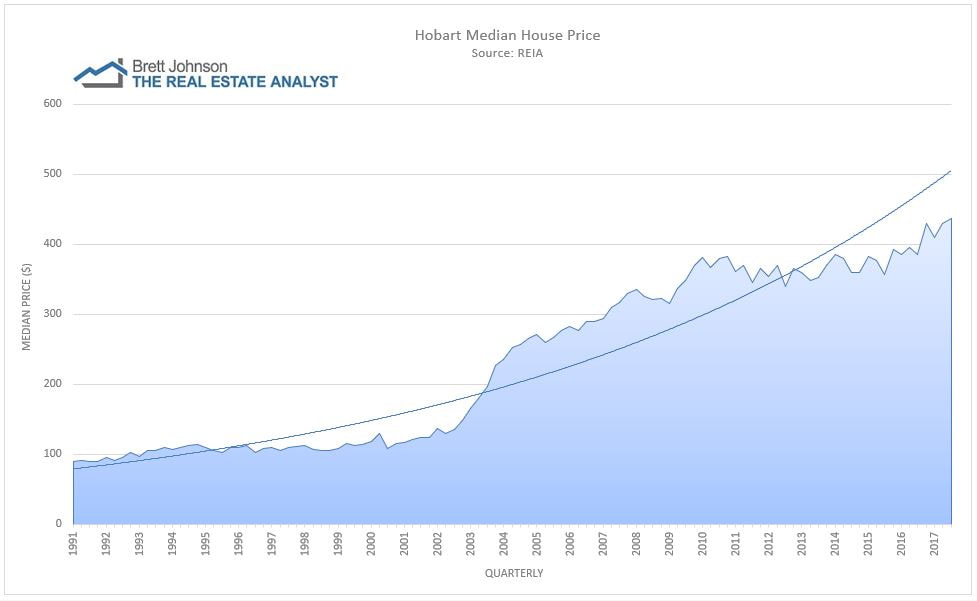
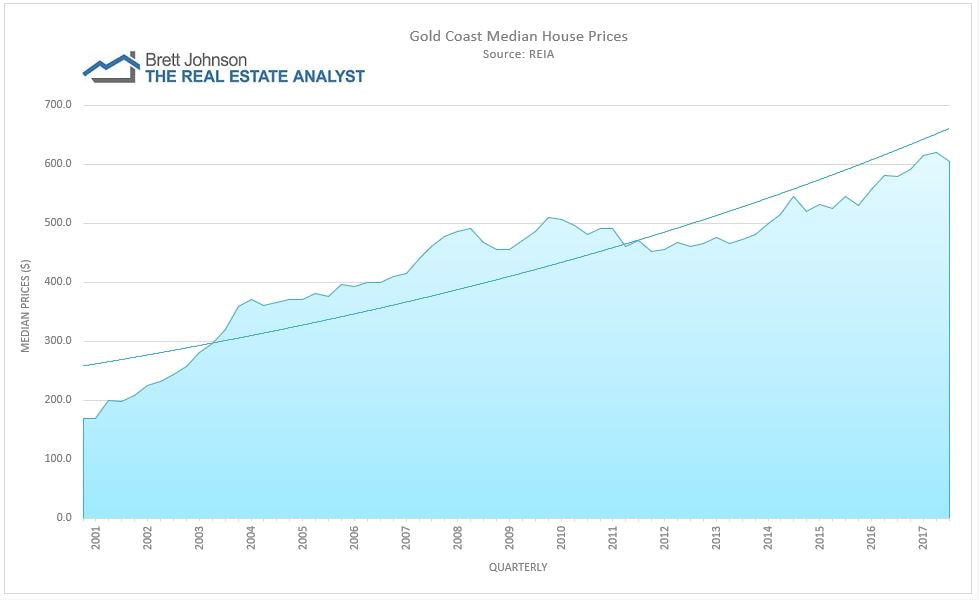
A collection of price charts for each major Australian market. Current charts include data up to September quarter 2017. Data is sourced from the Real Estate Institute of Australia quarterly market facts survey and is updated approximately 10 weeks after the close of each quarter. The trend line is the exponential line of best fit and is indicative of where the market is currently positioned in a longer term context. Charts do not represent percentage change or semi-log scale which are widely available elsewhere. Data is nominal house prices. |
Select market for median house price chart: Sydney
Melbourne
brisbane
canberra
adelaide
perth
hobart
gold coast
|